-
Home
- Showcase
Inventing a visual language to clarify company ownership
Transparency about who owns and controls companies is important. We designed the Beneficial Ownership Visualisation System (BOVS) to help OpenOwnership and other organisations clearly illustrate complex ownership relationships.
Any organisation can visualise the relationships between people, companies, states, and other entities in a consistent way by illustrating the situation using a BOVS Diagram.

Workshop: Untangling real-world complexity
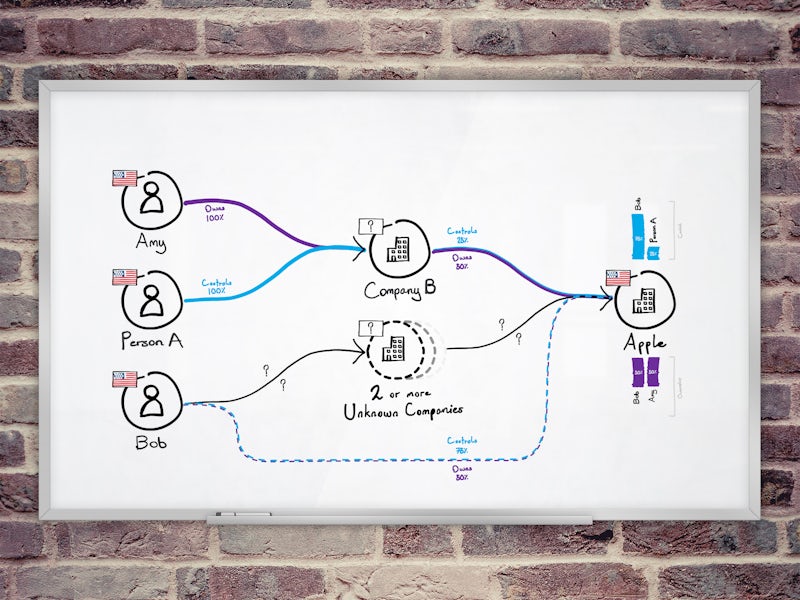
Through several workshops, discussions and iterations, we explored the many types of ownership relationship that exist in the real world, and therefore the flexibility that the diagramming system needed to have – including handling cases of unknown information.

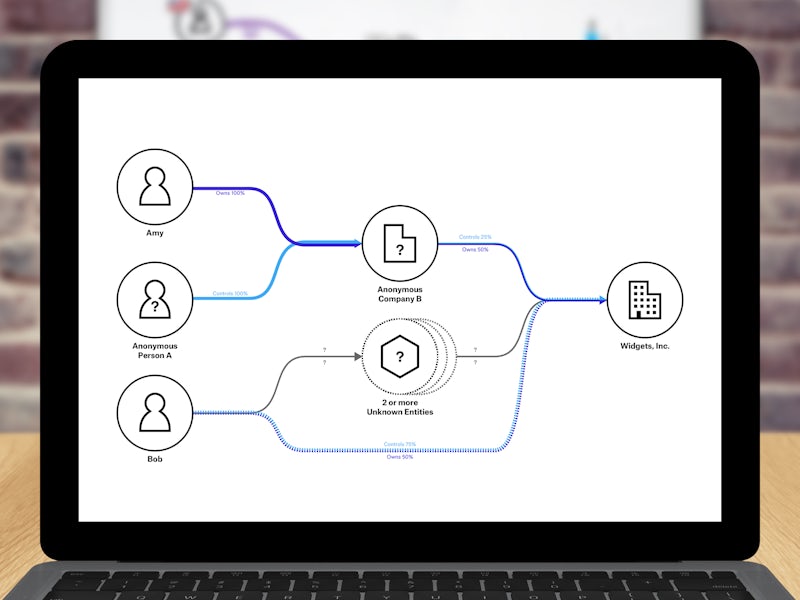
Diagrams: Clarity about who owns companies
BOVS was designed to be intelligible even if you’ve never encountered it before or know little about beneficial ownership. Relationships are illustrated through an intuitive directed graph: nodes are parties, edges (arrows) are ownership or control relationships.
Iconography: Distinct and meaningful symbols
Icons representing the key types of party were carefully designed to ensure each is simple enough to be hand-sketched while also conveying the right meaning. Each icon has a distinct outline, allowing it to be easily recognised at a glance just from its shape.

Documentation: Allowing anyone to create BOVS Diagrams
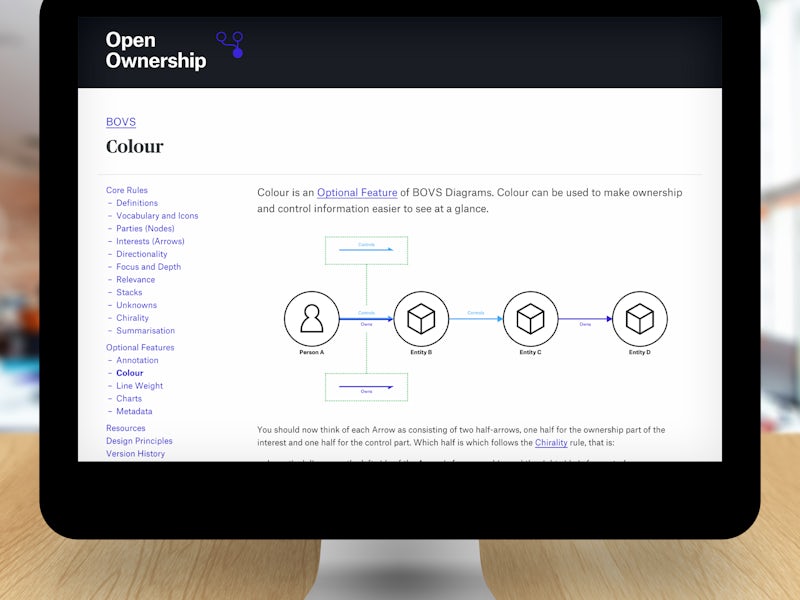
We wrote the illustrated guide on how to draw BOVS Diagrams, which we developed as an interlinked set of webpages. The guide divides the specifications into Core Rules and Optional Features to keep things as simple as possible, allowing designers to add complexity in layers as needed.
More
Contact
What could we do for you? Let's work together.
Key Services
Documents
We bring information into focus, and give ideas room to breathe.
Print Design
It’s not just paper and ink. We use design to print ideas and emotions.

